Distressed businesses often show clear signs of financial trouble, which can help investors, lenders, and restructuring professionals assess risks early. Key indicators include cash flow problems, rising debt, missed payments, management instability, and external economic pressures. Ignoring these signs can lead to poor decisions, hidden liabilities, and failed recovery efforts. Here’s a quick breakdown of the most telling credit risk indicators:
- Declining Cash Flow: Persistent liquidity issues, low current and quick ratios, or stretched cash conversion cycles signal deeper financial instability.
- Rising Debt Levels: High debt-to-equity ratios, frequent refinancing, and low debt service coverage ratios indicate unsustainable leverage.
- Late Payments: Missed payments to suppliers, overdue loans, or extended payment terms often reveal cash flow struggles.
- Management Changes: Frequent leadership turnover, vague communication, or governance issues highlight structural weaknesses.
- External Risks: Economic downturns, rising interest rates, industry-specific challenges, and regulatory changes exacerbate financial strain.
- Poor Credit Ratings: Downgrades and low credit scores reflect deeper financial problems and limit access to financing.
- Financial Report Red Flags: Shrinking working capital, inventory buildup, or revenue recognition issues point to operational troubles.
1. Declining Cash Flow and Liquidity Problems
Cash flow issues are often the clearest early warning sign of financial trouble for businesses. Persistent cash shortages don’t just hint at temporary setbacks – they often point to deeper structural problems that could eventually lead to bankruptcy.
Financial Health Indicators
When it comes to evaluating a company’s liquidity, operating cash flow trends are key. Unlike profit margins, which can sometimes be adjusted through accounting tactics, cash flow offers a more honest picture of a business’s ability to generate money from its core operations. This transparency is critical for potential investors and creditors looking to assess financial stability.
Metrics like the current ratio and quick ratio are also essential. A current ratio below 1.0 or a quick ratio under 0.5 typically signals serious liquidity challenges. Additionally, a debt service coverage ratio (DSCR) below 1.0 indicates that a company isn’t generating enough income to cover its debt obligations, raising red flags for creditors.
Another key metric is the cash conversion cycle. If this cycle starts to stretch out, it means the business is taking longer to turn investments into cash, which can signal worsening liquidity problems.
But numbers aren’t the only indicators. Behavioral patterns within the business can also provide early clues.
Behavioral and Operational Warning Signs
Struggling businesses often show telltale signs before the full extent of their financial issues becomes public. These include late payments to vendors, requests to renegotiate payment terms, and delays in meeting financial obligations. Such behaviors can emerge 30 to 90 days before financial statements reflect the underlying crisis.
Other red flags include irregular communication with lenders or suppliers and a reluctance to share updated financial information. These shifts in behavior often hint at liquidity problems that haven’t yet been formally reported.
Another warning sign is the sudden and unexplained use of credit lines. When a business quickly draws down its available credit without a clear plan for expansion, it’s often a sign of cash flow struggles rather than growth opportunities.
Macroeconomic and Industry-Specific Risk Factors
These internal red flags are often worsened by external economic pressures. For instance, as of 2023, corporate bankruptcies in the U.S. hit their highest levels since 2010. High-yield borrowers are facing borrowing costs near 9%, creating a tough environment for businesses already under financial strain.
One of the biggest challenges now is refinancing risk. Many companies with fixed-rate debt maturing in the next few years are finding it harder to refinance, especially as traditional lenders grow more cautious. Some businesses are preemptively rolling over debt at higher rates to avoid the risk of being unable to refinance later.
Rising interest rates, sluggish economic growth, and inflation are also putting significant pressure on cash flow. When the cost of financing outpaces revenue growth over a prolonged period, businesses often find themselves in a liquidity crunch that can spiral into a full-blown crisis.
To stay ahead of these risks, financial institutions are closely monitoring Key Risk Indicators (KRIs) like GDP growth, inflation, and unemployment rates. These macroeconomic metrics help predict which industries and businesses are most likely to experience cash flow problems, enabling lenders to take proactive measures.
2. Rising Debt and High Leverage Ratios
When a company’s debt far outweighs its cash flow, financial trouble is often just around the corner. This imbalance can quickly lead to collapse, making it essential to keep a close eye on financial ratios to assess how heavily a business relies on borrowing.
Financial Health Indicators
Key financial ratios, like the debt-to-equity ratio, shed light on how much a company depends on borrowed funds. A high debt-to-equity ratio points to a heavy reliance on debt, which can be a red flag. Other signs of poor debt management include low interest coverage ratios, weak debt service coverage ratios, and high levels of asset-backed financing.
Behavioral and Operational Warning Signs
Companies drowning in debt often show certain operational patterns. They might refinance frequently, sell off key assets, or cut back on capital investments just to keep up with debt payments. On top of that, management teams under the weight of high leverage may become less transparent in their communications, further signaling potential trouble.
Macroeconomic and Industry-Specific Risk Factors
Broader economic conditions can make matters worse for highly leveraged businesses. Rising interest rates and tighter credit markets drive up borrowing costs, making refinancing a challenge. Industry-specific factors also play a role. For example, retail businesses often depend on inventory financing, while tech companies may struggle with inconsistent cash flow. These dynamics can leave such sectors particularly exposed when the economy takes a downturn.
3. Late Payments and Payment Defaults
When businesses start missing payment deadlines, it often signals growing financial trouble. Payment habits can tell a lot about a company’s financial health and are key indicators when assessing distressed businesses.
Financial Health Indicators
Delayed payments usually point to cash flow issues. Warning signs include missed payments to suppliers, overdue loans, and delayed payroll. Another red flag is a drop in accounts payable turnover, showing that bills are being paid more slowly than usual.
A rising days payable outstanding (DPO) metric or attempts to negotiate longer payment terms often highlight liquidity problems. Suppliers, acting as informal early warning systems, may respond to poor payment histories by demanding cash on delivery or letters of credit instead of extending traditional terms.
Behavioral and Operational Warning Signs
These financial signals often show up in a company’s payment behavior. Under pressure, businesses might resort to partial payments to stretch limited cash, prioritizing key suppliers while deferring full payment. For instance, a company may pay part of an invoice to keep goods or services flowing, leaving the rest unpaid for later.
Management teams facing financial strain may also become less transparent, offering vague explanations for delays. In some cases, businesses may issue checks without sufficient funds, hoping to cover the shortfall before the checks clear. Another telltale sign is prioritizing secured debt payments while falling behind on unsecured obligations, reflecting difficult decisions being made to stay afloat. These operational shifts become even more pronounced during economic downturns.
Macroeconomic and Industry-Specific Risk Factors
Economic challenges can intensify the risk of payment defaults across industries. Sectors like construction or retail, which are sensitive to financing conditions or consumer spending, often see increased payment delays during tough times. Knowing the payment norms of a particular industry is crucial – industries with longer payment cycles might signal distress if terms are stretched further, while companies in service-based sectors with shorter cycles may raise concerns if payments become unusually delayed.
Rising interest rates add another layer of pressure, especially for companies with variable-rate debt. Balancing higher debt payments with supplier obligations becomes a challenge. Businesses in industries with seasonal cash flows, such as agriculture or tourism, are especially at risk during off-peak times when payment defaults tend to spike.
Credit Ratings and Quantitative Risk Models
Credit rating agencies keep a close eye on payment history to gauge a company’s creditworthiness. Defaults on payments often trigger credit reviews, leading to potential downgrades that make borrowing more difficult. Modern credit scoring models place significant weight on payment performance, meaning even a single late payment can hurt a business’s credit score. As payment problems pile up, reduced access to credit can worsen the cycle, making it harder for companies to meet their obligations.
Predictive tools are increasingly being used to track payment velocity – how quickly businesses pay their bills compared to agreed terms. A gradual slowdown in these payments can act as an early signal of deepening financial trouble.
4. Management Changes and Poor Governance
When a company faces financial trouble, management turnover often spikes, and governance issues come to light. While cash flow problems and rising debt levels are clear indicators of financial strain, frequent leadership changes and governance flaws can reveal deeper structural problems that speed up the decline.
Behavioral and Operational Warning Signs
Sometimes, the clearest signs of trouble come from what’s happening inside the leadership team, not just the financial reports.
- Frequent executive turnover: When CEOs, CFOs, or other key leaders leave in quick succession, it’s often a sign of disagreements over strategy or doubts about the company’s direction. Similarly, board members resigning may signal a loss of confidence in the leadership.
- Lack of transparency: Leadership turnover is often accompanied by vague communication, as companies may attempt to buy time while scrambling for solutions.
- Delays in decision-making: Weak governance often leads to hesitation. Critical decisions get postponed, capital is allocated inconsistently, and operational issues are ignored. Poor internal controls can result in accounting errors or compliance failures, further eroding trust.
- Communication breakdowns: Miscommunication between management and stakeholders becomes more common. Suppliers struggle to reach decision-makers, employees feel uncertain about the company’s future, and investors are left in the dark about financial performance.
Macroeconomic and Industry-Specific Risk Factors
Economic conditions and industry trends can make governance problems even worse.
During recessions, management teams face intense pressure to act quickly, which can lead to rushed leadership changes. Industries undergoing rapid technological shifts, like retail or media, often see higher turnover as companies grapple with staying relevant.
In heavily regulated sectors like healthcare or financial services, leadership changes can trigger additional regulatory scrutiny. This creates extra compliance challenges at a time when resources are already stretched thin. Family-owned businesses in more traditional sectors may resist bringing in outside expertise, worsening governance issues during critical periods.
Seasonal industries, such as construction or tourism, face unique pressures. Off-peak periods often tighten cash flow, leading to management turnover, especially when companies lack sufficient reserves to weather the slow season.
Credit Ratings and Quantitative Risk Models
Management instability doesn’t just disrupt operations – it directly affects credit ratings. Rating agencies place high importance on leadership continuity, especially when companies are trying to execute turnaround plans.
Governance issues, such as covenant breaches or declining governance scores, make borrowing more expensive and limit access to credit markets. Increasingly, predictive models are factoring in management quality metrics – like how long executives have been in their roles, the composition of the board, and the effectiveness of audit committees. These indicators can often flag potential financial trouble before traditional metrics like profit margins or debt ratios catch up.
5. Economic and Industry Risk Factors
External forces often play a critical role in shaping the credit risk of distressed businesses. While internal challenges like governance and cash flow issues are significant, macroeconomic and industry-specific factors can heavily influence a company’s ability to recover. These external pressures bring unique financial, operational, and regulatory hurdles, as outlined below.
Macroeconomic and Industry-Specific Risk Factors
Certain industries, especially cyclical ones like automotive, construction, and hospitality, are particularly vulnerable during economic downturns. Companies in these sectors, often carrying substantial debt, tend to see sharp revenue declines when demand weakens.
Rising interest rates can add immediate pressure to businesses with heavy debt loads. When the Federal Reserve raises rates, companies with variable-rate loans face higher interest payments. This is especially challenging for sectors like retail and real estate, which depend on affordable credit to fuel growth and operations.
Supply chain disruptions are another destabilizing factor. Recent global challenges have caused production delays and cash flow problems, particularly for smaller suppliers that operate with slim margins. A sudden drop in order volumes can quickly throw these businesses into financial distress, affecting broader financial metrics.
Regulatory changes also present unique risks. For example, healthcare companies must adapt to shifting reimbursement policies and compliance mandates, while energy firms face stricter environmental requirements. Financial services companies, on the other hand, often grapple with evolving capital requirements that directly impact their lending capabilities.
Technological changes can permanently disrupt traditional industries. For instance, digital platforms have significantly impacted retail and print media, reshaping consumer behavior and revenue streams. These long-term shifts can make recovery far more difficult than a temporary economic downturn.
Financial Health Indicators
Economic pressures often expose weaknesses in a company’s financial structure. For instance, upcoming debt maturities can highlight refinancing difficulties during periods of economic stress.
External factors also complicate working capital and inventory management. Lengthened receivables cycles, caused by delayed customer payments, can strain cash flow. At the same time, suppliers may demand faster payments or even cash-on-delivery terms, adding additional pressure. Maintaining appropriate inventory levels becomes increasingly difficult when demand fluctuates unpredictably.
For businesses with international operations, currency risks add another layer of complexity. A stronger domestic currency can hurt exporters, while companies with foreign-denominated debt may face higher repayment costs during volatile periods. These challenges can amplify financial strain in an already uncertain economic environment.
Credit Ratings and Quantitative Risk Models
Credit rating agencies closely monitor economic and industry trends, integrating them into their assessment models. These models are often tailored to specific sectors, reflecting their unique performance patterns during various economic cycles. For instance, retail companies may be evaluated differently during peak sales seasons compared to energy firms, which are more sensitive to commodity price fluctuations.
Peer comparisons within an industry help identify the most vulnerable companies. By analyzing metrics like debt service coverage, inventory turnover, and customer concentration, analysts can detect early warning signs of financial trouble, complementing the cash flow and leverage metrics discussed earlier.
Real-time economic indicators, such as changes in unemployment rates, consumer confidence, and commodity prices, now play a more prominent role in credit risk models. These dynamic tools allow analysts to adapt quickly as economic conditions shift, ensuring that risk assessments remain relevant and responsive to changing environments.
6. Poor Credit Ratings and Low Credit Scores
When assessing a company’s financial health, credit ratings and scores play a key role. These metrics provide a consistent way to measure creditworthiness, offering insight into potential vulnerabilities. A decline in these scores often points to deeper financial troubles and can accelerate a company’s downward spiral.
Financial Health Indicators
Credit rating agencies like Moody’s, S&P, and Fitch evaluate a company’s financial standing using critical metrics, such as debt-to-equity ratios, interest coverage, and cash flow stability. When businesses face liquidity issues or take on excessive debt, these agencies may issue downgrades.
Typically, investment-grade ratings (like BBB- or higher from S&P) signal a stable credit profile. Companies rated below this threshold are seen as higher risk and often struggle to secure traditional financing options. Similarly, commercial credit scores from providers like Dun & Bradstreet or Experian assess payment behavior. For instance, a low PAYDEX score – indicating late payments – highlights poor payment habits, while a high score reflects consistent and timely payments. These scores incorporate factors like payment history, credit usage, and company-specific details to create a comprehensive risk profile.
Behavioral and Operational Warning Signs
Declining credit metrics often reveal troubling patterns in a business’s operations. Companies with falling scores may show erratic payment behavior, paying some obligations on time while delaying others. Debt restructuring, while sometimes necessary, can also negatively impact credit ratings and strain relationships with suppliers.
Other red flags include reductions in credit limits from banks or suppliers. Financial institutions closely monitor credit scores, and a drop can result in tighter credit access. This, in turn, increases cash flow pressures, forcing businesses to secure financing under less favorable conditions. Such developments not only suggest liquidity problems but also pave the way for more severe financial constraints, as highlighted by predictive risk models.
Credit Ratings and Quantitative Risk Models
Modern tools for credit assessment use real-time data and predictive analytics to detect early warning signs of financial distress. Sector-specific models go a step further by factoring in industry-specific characteristics and comparing a company’s performance to peers. These comparisons can spotlight underperformance and provide deeper context.
Some of these models also estimate default probabilities over specific timeframes by analyzing payment trends and financial data. This information is invaluable for potential buyers or restructuring professionals, helping them determine the urgency and scale of intervention required.
For investors exploring distressed businesses through platforms like Urgent Exits, understanding credit ratings and scores is essential. These metrics serve as a foundation for distinguishing between companies facing temporary setbacks and those grappling with deep-seated structural challenges.
7. Warning Signs in Financial Reports
Financial reports can be a treasure trove of insights, especially when it comes to spotting early signs of trouble. While companies often try to project confidence, the numbers can reveal a different story if you know what to look for. These financial signals complement earlier operational and management red flags, offering hard data to back up observations.
Financial Health Indicators
Balance sheet red flags – such as negative or shrinking working capital – indicate that liabilities are outpacing assets. This often forces companies to lean heavily on short-term financing, which can be a precarious position.
Revenue recognition irregularities are another warning sign. For instance, if accounts receivable are growing faster than sales, it may point to aggressive accounting practices or trouble collecting payments – both of which can mask declining performance.
Asset impairments and write-downs suggest deeper operational struggles. When assets are revalued lower, it often signals that they’re not generating the returns initially expected. Goodwill impairments, in particular, can highlight that acquisitions haven’t panned out as planned, possibly because the company overpaid.
Inventory buildup compared to sales can indicate slowing demand or poor inventory management. A sharp increase in inventory days outstanding ties up cash and could lead to markdowns or write-offs down the line.
Behavioral and Operational Warning Signs
Numbers don’t tell the whole story. Internal practices can also reveal signs of distress.
Frequent restatements of financial results create uncertainty and undermine trust. These often point to weak internal controls or overly aggressive accounting methods.
Auditor changes are another red flag, especially when disagreements over accounting treatments are involved. If a long-standing auditor relationship ends abruptly, it could signal disputes over financial practices or an auditor’s refusal to approve questionable decisions.
Increased related party transactions can be a sign of trouble. These dealings, such as sales to affiliated entities or insider loans, may artificially bolster results or mask underlying issues.
Delayed SEC filings are a major concern. Companies that regularly request extensions for 10-K or 10-Q reports may be struggling with internal controls, facing auditor disputes, or dealing with complex accounting challenges.
MD&A inconsistencies – when management’s discussion and analysis doesn’t align with the reported numbers – can be a red flag. If management blames external factors for poor results while competitors in the same industry are performing well, it’s worth digging deeper to uncover company-specific problems.
Macroeconomic and Industry-Specific Risk Factors
Broader economic and industry trends can also expose vulnerabilities.
Sector concentration risks arise when companies rely too heavily on declining industries or troubled geographic regions. Dependence on a single customer, supplier, or market segment increases exposure to external shocks.
Currency exposure is a critical factor for multinational companies. Exchange rate volatility can lead to translation losses that erode equity or increase borrowing costs for companies with foreign currency debt.
Rising regulatory compliance costs can strain profitability, especially in industries facing new regulations. When compliance expenses grow faster than revenue, it’s a sign the company may be struggling to adapt.
These financial metrics provide an objective lens to evaluate a company’s health, complementing earlier behavioral indicators. For investors and restructuring professionals using tools like Urgent Exits, understanding these warning signs can help determine whether a business is facing temporary setbacks or deeper structural problems. The key is to look at the bigger picture – analyzing multiple indicators together rather than relying on just one to assess financial risk.
Credit Risk Indicator Comparison
When analyzing distressed businesses, different credit risk indicators each bring unique advantages and challenges. Understanding how these tools stack up can help investors and restructuring professionals decide which opportunities to pursue and which may signal deeper financial trouble.
For instance, behavioral indicators – like irregular communication or sudden requests to renegotiate terms – can often flag issues before financial ratios, such as declining revenue or rising debt-to-equity, reflect measurable problems. On the other hand, Probability of Default (PD) models offer a more advanced, forward-looking perspective that traditional metrics might miss. For example, by the end of 2024, the average PD for U.S. public companies hit 9.2%, showcasing its ability to reflect current market conditions. However, interpreting PD shifts can be tricky. Take the Transportation sector: a 25.7% increase in average PD over 12 months required deeper analysis to identify which borrowers posed the greatest risks.
Here’s a quick comparison of key credit risk indicators:
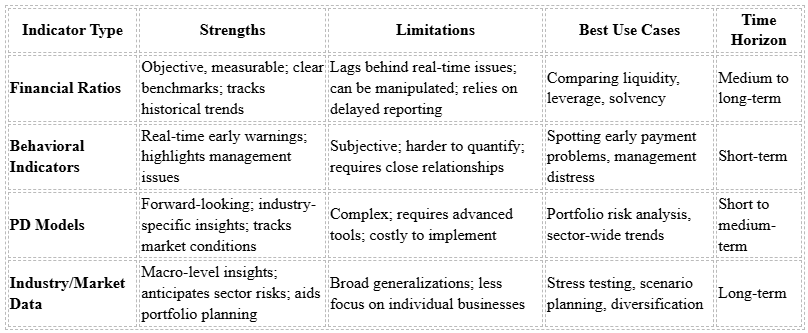
This table highlights the importance of balancing quantitative data with qualitative insights for a well-rounded evaluation.
Resource Needs and Challenges
Each method also comes with different resource demands. Traditional financial metrics rely on financial statements and credit reports, but these can be delayed or incomplete for struggling businesses. Financial ratio analysis is the most accessible, requiring only basic financial analysis skills and publicly available data. On the other hand, PD models often involve hefty licensing fees and require advanced expertise, making them less practical for smaller firms. For example, the Federal Reserve’s Senior Loan Officer Survey revealed that 18.5% of banks tightened commercial and industrial loan standards in Q2 2025, up from 6% in Q1, underscoring even large institutions’ challenges.
The Case for a Combined Approach
No single indicator type provides a complete picture. A mix of tools – capturing both early behavioral shifts and delayed financial metrics – offers the most effective strategy for evaluating distressed businesses. For buyers assessing opportunities on platforms like Urgent Exits, integrating diverse indicators helps refine decisions based on available resources and timelines.
Finally, industry-specific factors add another layer of complexity. Early warning systems often compare a company’s PD to sector-specific thresholds, as default risks vary widely by industry. For example, a debt-to-equity ratio that’s concerning in one sector might be perfectly acceptable in another. This variation underscores the importance of tailoring evaluations to the specific context of each business.
Conclusion
Seasoned investors know that credit risk indicators are most effective when used together rather than in isolation. Financial ratios offer clear benchmarks for assessing liquidity and leverage, while behavioral indicators can often flag potential issues early. By combining these tools, you get a more complete picture of a business’s financial health.
This comprehensive approach requires a strategy tailored to the data you have and the time you have to act. When working with limited information or under tight deadlines, focusing on cash flow patterns and payment behavior can quickly signal whether a business is worth pursuing. For larger investments or portfolio-level decisions, integrating advanced modeling tools and sector-specific insights becomes essential.
The current U.S. market environment calls for this layered approach. With banks tightening lending standards and default risks climbing across industries, having a well-rounded evaluation process gives buyers a critical edge. Identifying businesses with solid fundamentals can help counter broader economic pressures.
On platforms like Urgent Exits, where listings may come with limited details and tight timelines, prioritizing real-time behavioral signals alongside available financial data ensures you can act quickly and confidently. In such cases, speed and informed decision-making are key.
Ultimately, evaluating distressed businesses effectively means leveraging a mix of indicators to spot opportunities that others might miss.
FAQs
What behavioral signs can help investors identify a company facing financial distress?
Investors should keep an eye out for behavioral cues like frequent employee turnover, rising absentee rates, and slumping productivity – these can signal deeper operational or financial challenges within a company.
Additional warning signs to watch for include delays in financial reporting, inefficiencies in operations, and ongoing negative cash flow. By staying alert to these patterns, investors can identify potential issues early and make smarter, more strategic decisions.
How do financial ratios differ from Probability of Default (PD) models in evaluating credit risk?
Financial ratios are essential indicators drawn from a company’s financial statements. They include measures like liquidity, profitability, and leverage ratios, offering a clear view of a company’s financial status and how well it’s performing operationally. These metrics are particularly useful for evaluating whether a business can meet its financial obligations.
In contrast, Probability of Default (PD) models take a more predictive approach. They use statistical techniques to estimate the chances that a borrower might default on a loan within a set period. These models pull from historical default trends, credit scores, and other relevant data to anticipate potential risks.
While financial ratios provide insight into a company’s current condition, PD models look ahead, making the two tools complementary for a thorough credit risk evaluation.
How do rising interest rates affect the credit risk of distressed businesses?
Rising interest rates can create serious challenges for businesses already under financial strain. As borrowing costs climb, these companies face higher interest expenses, which eat into their cash flow and make it tougher to keep up with debt payments or maintain financial stability.
On top of that, higher rates often result in lower business valuations and less investor interest. This double hit makes it harder for struggling businesses to attract the capital they need. The outcome? Refinancing existing debt or securing new funding becomes an uphill battle, leaving these companies even more vulnerable to financial distress.